ST Segment
ST Segment Introduction
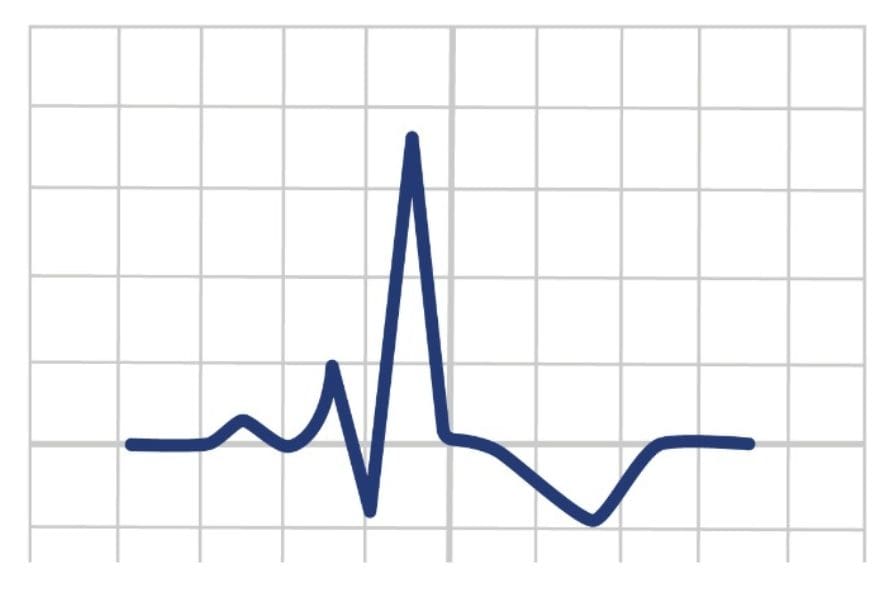
The ST segment is a crucial component of an ECG, representing the period between ventricular depolarisation (contraction) and repolarisation (relaxation) the of heart. Normally, it’s a flat, isoelectric section that follows the QRS complex and precedes the T wave.

ST Segment Abnormalities
When analysing the ST segment, it is important to assess the elevation or depressions from the baseline and consider the shape, duration along with associated patient symptoms to determine potential cardiac issues accurately.
The ST segment is often affected during myocardial infarction or ischaemia with elevation and depression as the two predominant abnormalities.

ST Segment Elevation
Different patterns of ST segment elevation may appear depending upon the underlying cause. The following causes may have associated ST segment elevation:
Acute Myocardial Infarction
Acute ST Elevation Myocardial Infarction (STEMI) can present with varying ST elevation morphologies.

The ECG criteria for a STEMI is defined as:
>1mm ST segment elevation in 2 contiguous limb leads or
>2mm ST segment elevation in 2 contiguous precordial (chest) leads.
Q waves, reciprocal ST depression and T wave inversion is also often seen in STEMI. ST elevation occurs in leads that represent coronary artery vessel territory (E.G. Inferior STEMI). Read more on ECG territories here.
If the above are seen on an ECG but no ST segment elevation present, then a non-ST elevation myocardial infarction (NSTEMI) may be present. Read more on NSTEMI here.
Pericarditis
Pericarditis occurs as a result of inflammation of the pericardium, a thin, double-layered sac surrounding the heart. Widespread, concave upward ST-segment elevation is seen along with other features such as PR segment depression. Read more on Pericarditis ECGs here.

Benign Early Repolarisation
Benign Early Repolarisation (BER) can be associated with similar ECG changes to that of pericarditis with ST elevation and tall T Waves with notching on the J point sometimes seen. Read more on Benign Early Repolarisation ECGs here.

Left Bundle Branch Block
LBBB may shows ST segment elevation and tall T waves in leads with negative QRS complexes and ST depression with T wave inversion on positive QRS complexes.
Leads V1-V3 may show ST elevation with deep S waves.
Leads V4-V6 may show ST depression with tall R waves.
Read more on Bundle Branch Blocks here.

Brugada Syndrome
Brugada Syndrome, an inherited channelopathy leads to paroxysmal ventricular arrhythmias and sudden cardiac death.
It has ST elevation with a coved morphology and partial RBBB features in V1-V2. Read more on Brugada Syndrome here.
Raised Intracranial Pressure
Raised Intracranial Pressure can cause findings such as ST segment elevation like that of MI or pericarditis. More commonly, widespread T wave inversion would be seen in raise ICP.
ST Segment Depression
Different patterns of ST segment depression may appear depending upon the underlying cause. The following causes may have associated ST segment elevation:
Reciprocal STEMI Changes
During a STEMI, reciprocal changes usually appear. ST depression may be seen as down sloping, up sloping or horizontal.

Reciprocal changes tend to resemble upside down ST elevation and seen in leads that oppose the site of infarction.

Digoxin Effect
Digoxin effect can cause a scooped appearance of the ST segment, mimicking ST segment depression. Other features may include T wave abnormalities and short QT intervals. Read more on digoxin effect here.

Hypokalaemia
Low potassium levels typically present as a downward-sloping ST segment (usually widespread) alongside flattened or inverted T waves and the emergence of U waves.
ECG Examples
Conclusion
The ST segment on an ECG represents the period between ventricular depolarisation and repolarisation. A normal ST segment is typically isoelectric (at the baseline) and signifies a period where the ventricles are electrically depolarised but have not yet repolarised.
However, deviations in the ST segment can indicate myocardial damage, ischemia, or other cardiac issues.
Key Points
-
The ST segment represents the period between ventricular depolarisation and repolarisation.
-
Changes in the ST segment, such as elevation or depression from the baseline, can be indicative of various cardiac conditions.
-
ST segment elevation is a hallmark of a heart attack (myocardial infarction), suggesting acute damage to the heart muscle.
Bibliography
Joint Royal Colleges Ambulance Liaison Committee and Association of Ambulance Chief Executives (2022). JRCALC Clinical Guidelines 2022. Class Professional Publishing
Kashou, A. H., & Kashou, H. E. (2019). Rhythm, ST Segment. Nih.gov; StatPearls Publishing. https://www.ncbi.nlm.nih.gov/books/NBK459364/
ST Segment Introduction
The ST segment is a crucial component of an ECG, representing the period between ventricular depolarisation (contraction) and repolarisation (relaxation) the of heart. Normally, it’s a flat, isoelectric section that follows the QRS complex and precedes the T wave.
ST Abnormalities
When analysing the ST segment, it is important to assess the elevation or depressions from the baseline and consider the shape, duration along with associated patient symptoms to determine potential cardiac issues accurately.
The ST segment is often affected during myocardial infarction or ischaemia with elevation and depression as the two predominant abnormalities.
ST Segment Elevation
Different patterns of ST segment elevation may appear depending upon the underlying cause. The following causes may have associated ST segment elevation:
Acute Myocardial Infarction
Acute ST Elevation Myocardial Infarction (STEMI) can present with varying ST elevation morphologies.
The ECG criteria for a STEMI is defined as:
>1mm ST segment elevation in 2 contiguous limb leads or
>2mm ST segment elevation in 2 contiguous precordial (chest) leads.
Q waves, reciprocal ST depression and T wave inversion is also often seen in STEMI. ST elevation occurs in leads that represent coronary artery vessel territory (E.G. Inferior STEMI). Read more on ECG territories here.
If the above are seen on an ECG but no ST segment elevation present, then a non-ST elevation myocardial infarction (NSTEMI) may be present. Read more on NSTEMI here.
Pericarditis
Pericarditis occurs as a result of inflammation of the pericardium, a thin, double-layered sac surrounding the heart. Widespread, concave upward ST-segment elevation is seen along with other features such as PR segment depression. Read more on Pericarditis ECGs here.
Benign Early Repolarisation
Benign Early Repolarisation (BER) can be associated with similar ECG changes to that of pericarditis with ST elevation and tall T Waves with notching on the J point sometimes seen. Read more on Benign Early Repolarisation ECGs here.
Left Bundle Branch Block
LBBB may shows ST segment elevation and tall T waves in leads with negative QRS complexes and ST depression with T wave inversion on positive QRS complexes.
Leads V1-V3 may show ST elevation with deep S waves.
Leads V4-V6 may show ST depression with tall R waves.
Read more on Bundle Branch Blocks here.
Brugada Syndrome
Brugada Syndrome, an inherited channelopathy leads to paroxysmal ventricular arrhythmias and sudden cardiac death.
It has ST elevation with a coved morphology and partial RBBB features in V1-V2. Read more on Brugada Syndrome here.
Raised Intracranial Pressure
Raised Intracranial Pressure can cause findings such as ST segment elevation like that of MI or pericarditis. More commonly, widespread T wave inversion would be seen in raise ICP.
ST Segment Depression
Different patterns of ST segment depression may appear depending upon the underlying cause. The following causes may have associated ST segment elevation:
Reciprocal STEMI Changes
During a STEMI, reciprocal changes usually appear. ST depression may be seen as down sloping, up sloping or horizontal.
Reciprocal changes tend to resemble upside down ST elevation and seen in leads that oppose the site of infarction.
Digoxin Effect
Digoxin effect can cause a scooped appearance of the ST segment, mimicking ST segment depression. Other features may include T wave abnormalities and short QT intervals. Read more on digoxin effect here.
Hypokalaemia
Low potassium levels typically present as a downward-sloping ST segment (usually widespread) alongside flattened or inverted T waves and the emergence of U waves.
ECG Examples
Conclusion
The ST segment on an ECG represents the period between ventricular depolarisation and repolarisation. A normal ST segment is typically isoelectric (at the baseline) and signifies a period where the ventricles are electrically depolarised but have not yet repolarised.
However, deviations in the ST segment can indicate myocardial damage, ischemia, or other cardiac issues.
Key Points
- The ST segment represents the period between ventricular depolarisation and repolarisation.
- Changes in the ST segment, such as elevation or depression from the baseline, can be indicative of various cardiac conditions.
- ST segment elevation is a hallmark of a heart attack (myocardial infarction), suggesting acute damage to the heart muscle.
Bibliography
Joint Royal Colleges Ambulance Liaison Committee and Association of Ambulance Chief Executives (2022). JRCALC Clinical Guidelines 2022. Class Professional Publishing
Kashou, A. H., & Kashou, H. E. (2019). Rhythm, ST Segment. Nih.gov; StatPearls Publishing. https://www.ncbi.nlm.nih.gov/books/NBK459364/